Inktrue sample report
Your 10 page Inktrue report, explained.
It doesn't matter if you're the one signing the lease or collecting the rent; our goal is true data transparency so both sides can see eye to eye.
Free. No scams. No credit card required.
Page 1 of 10
Professional Grade Analysis
This level of rent analysis has historically only been available to sophisticated investors with a team of expensive consultants. We are here to change that. The Inktrue report provides a professional-grade market rent analysis with a mountain of data and a transparent value methodology to justify it.
Page 2 of 10 · Section 01
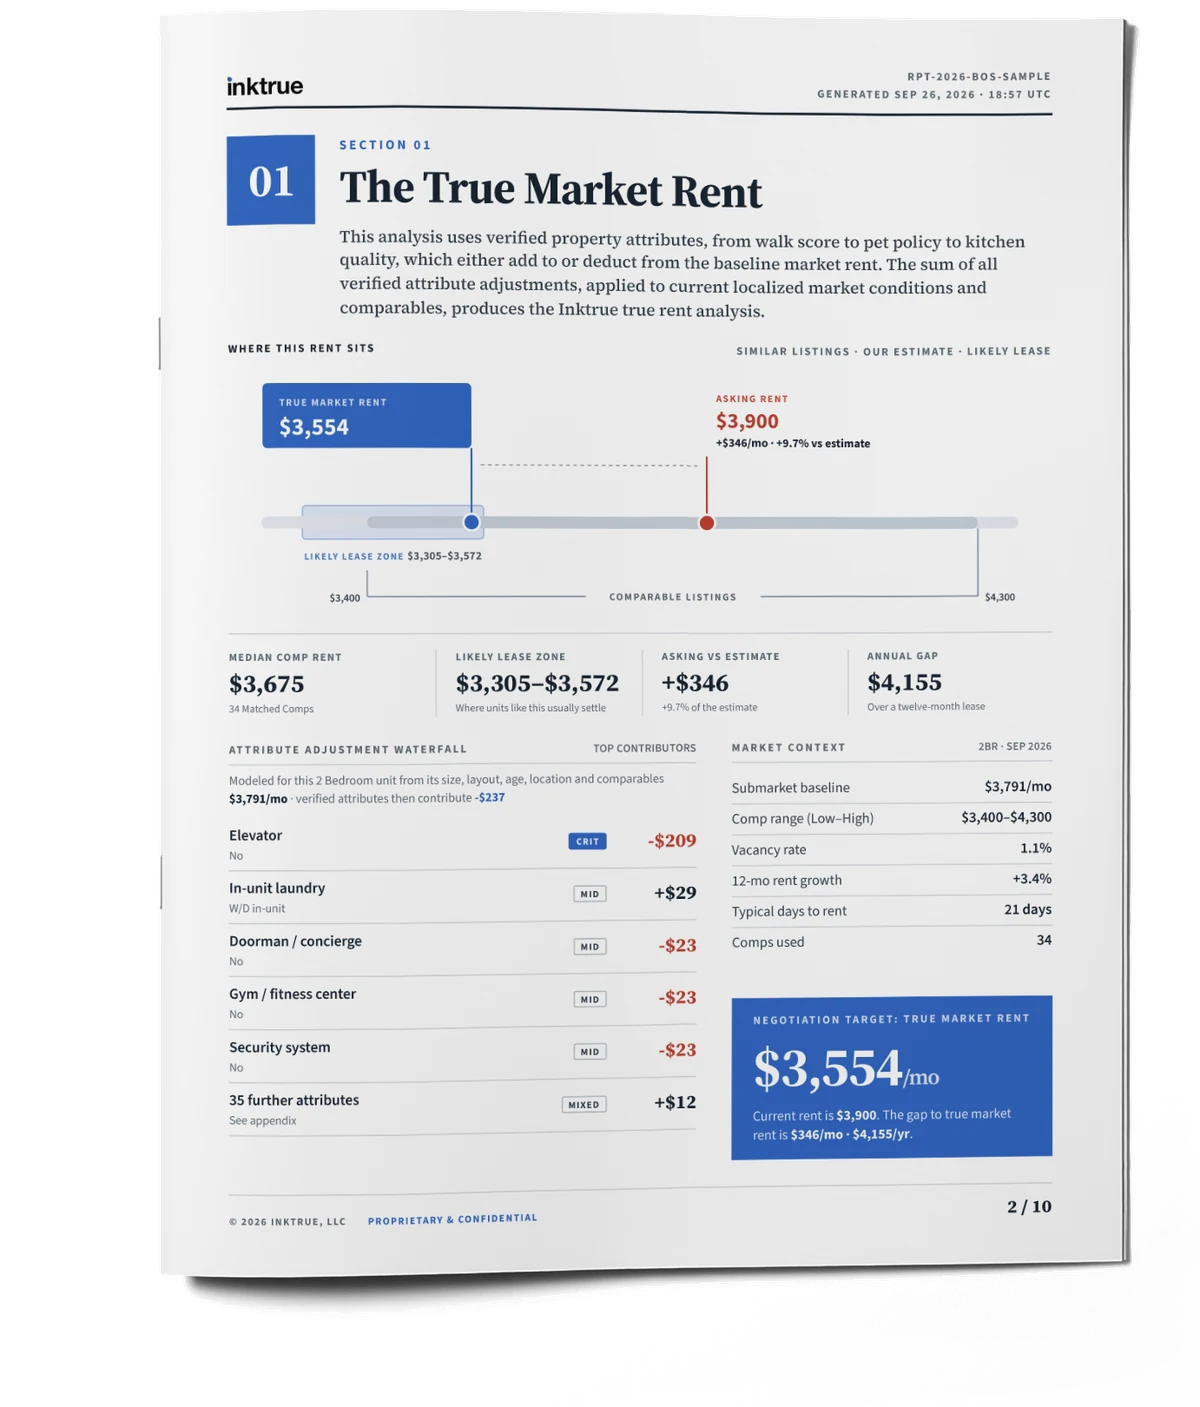
True Market Rent
We put the true market rent right next to the current or asking rent, side by side, and expose any distance between the two. Tenants and owners see the same data and the unit is either exposed as an above-market splurge, or a bargain worth jumping on. Neither side has to take the other's word for it since the same numbers, built on the same math, using the exact unit features, are visible to everyone.
Page 3 of 10 · Section 02
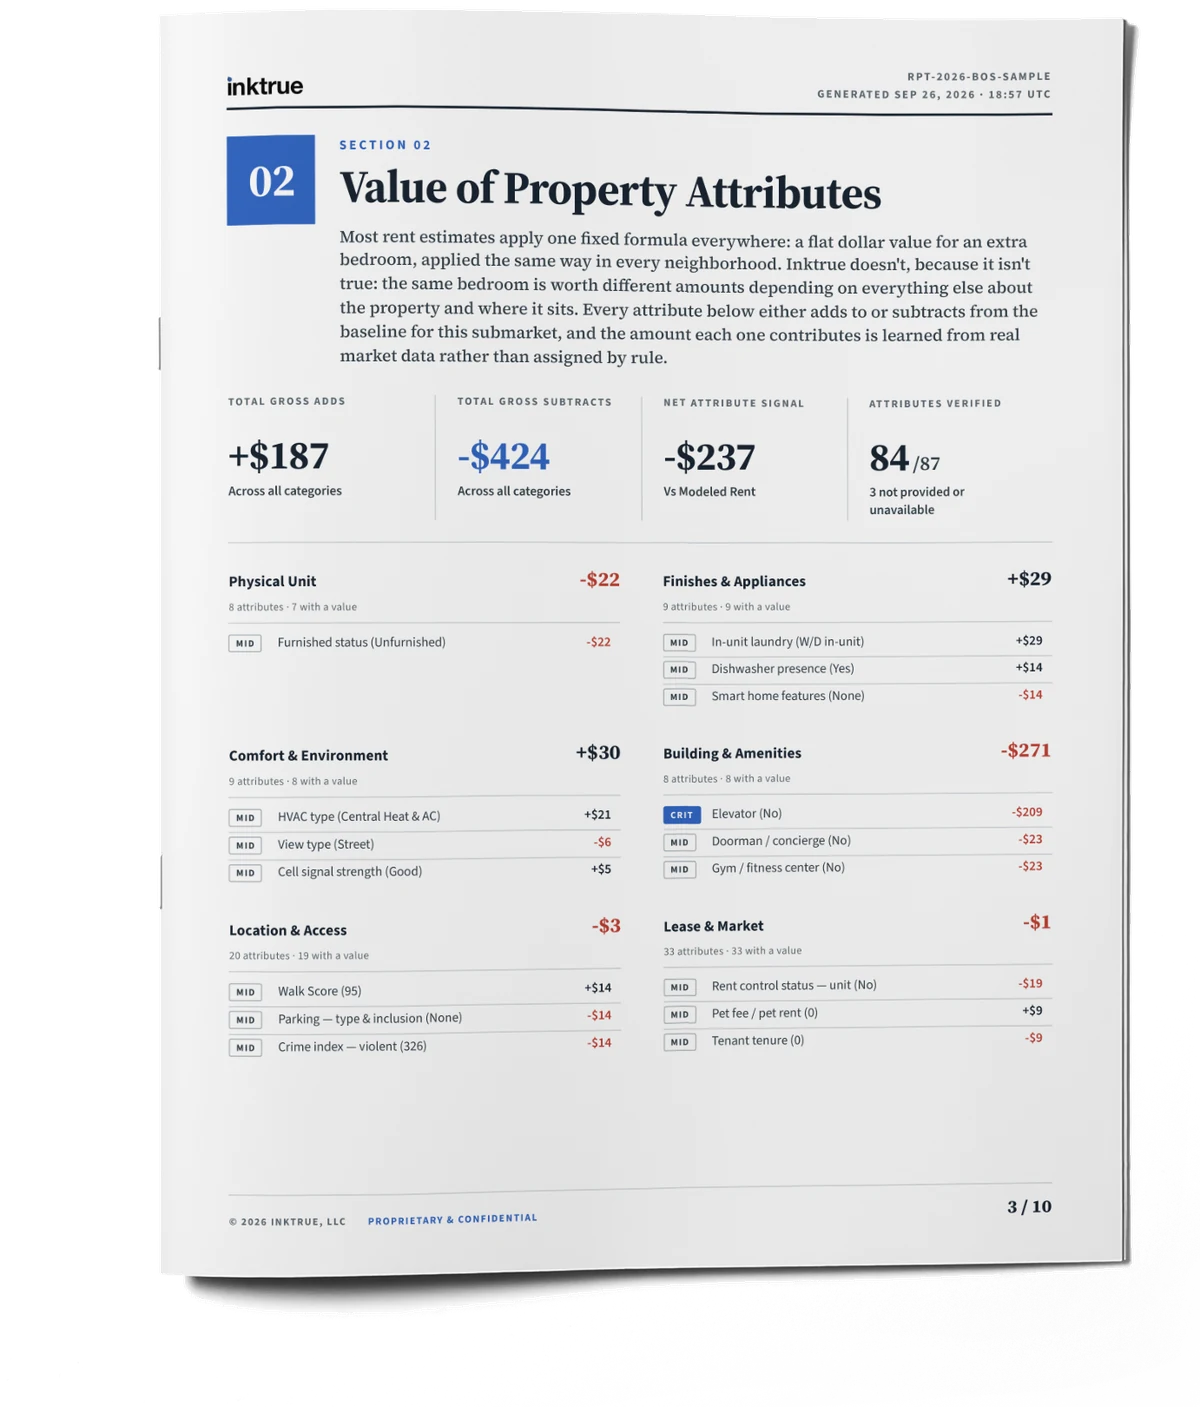
Value of Property Attributes
Every attribute that moved the price is itemized here, grouped the way a renter or owner actually thinks about a property: the unit itself, its finishes and appliances, how it feels to live in, the building's amenities, where it sits, and what the lease costs. For a tenant, it answers "what exactly am I paying for?" For an owner, it's a checklist of which upgrades are reflected in rent and which aren't earning their keep. Each amount is learned from real market data rather than assigned by a fixed rule, so the same feature can be worth different amounts in different neighborhoods.
Page 4 of 10 · Section 03
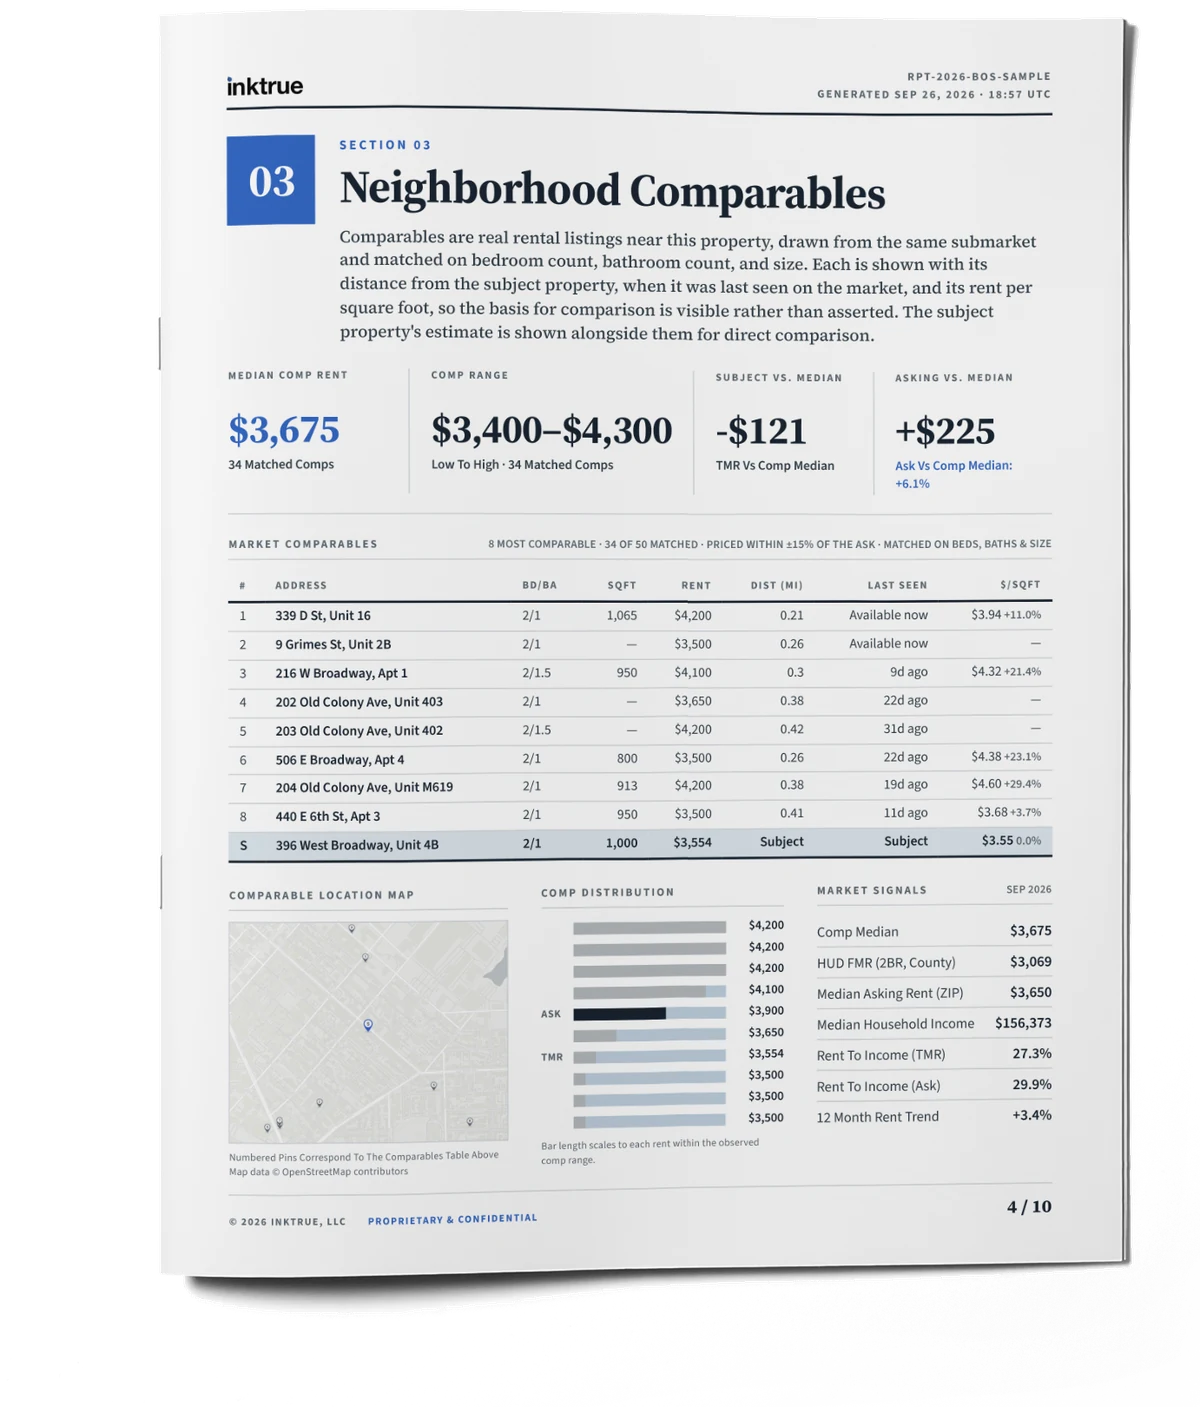
Neighborhood Comparables
A true market analysis is only as credible as the strength of the comps behind it. This page shows the closest comparable properties that were used to calculate the true market rent, weighted by distance, recency, and similarity. A tenant can confirm the number reflects real properties around the corner and an owner can point to the same table when justifying the asking rent to a skeptical prospect.
Page 5 of 10 · Section 04
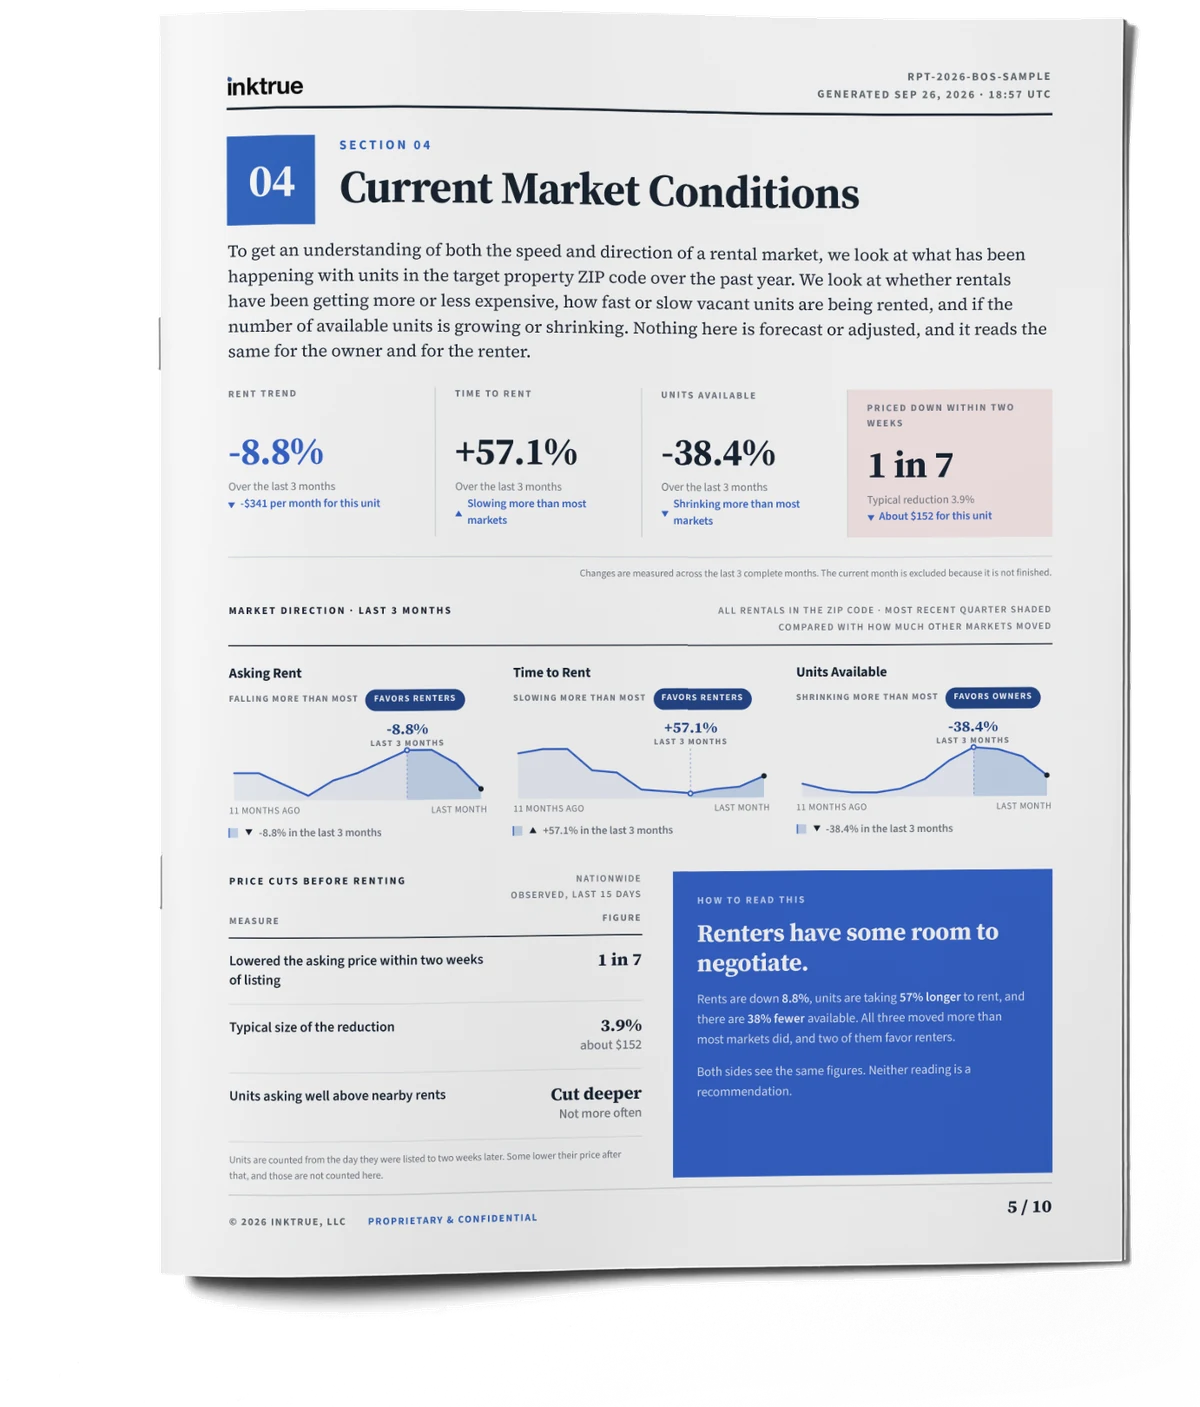
Local Market Momentum
Every negotiation happens within a market, and this page shows what that market has actually been doing. It tracks three key data points in the property's ZIP code over the past year: whether asking rents are rising or falling, how quickly vacant units are being rented, and whether the number of available units is either growing or shrinking. It also shows how often nearby landlords cut the price before a unit rents, and by how much. Nothing here is a forecast. Each measurement is labeled with the side it currently favors, so a renter can see when the market is giving them room to ask for a concession and an owner can see when they can comfortably hold their price. Both parties read the same page and draw the same conclusion about timing, which is the point.
Page 6 of 10 · Section 05
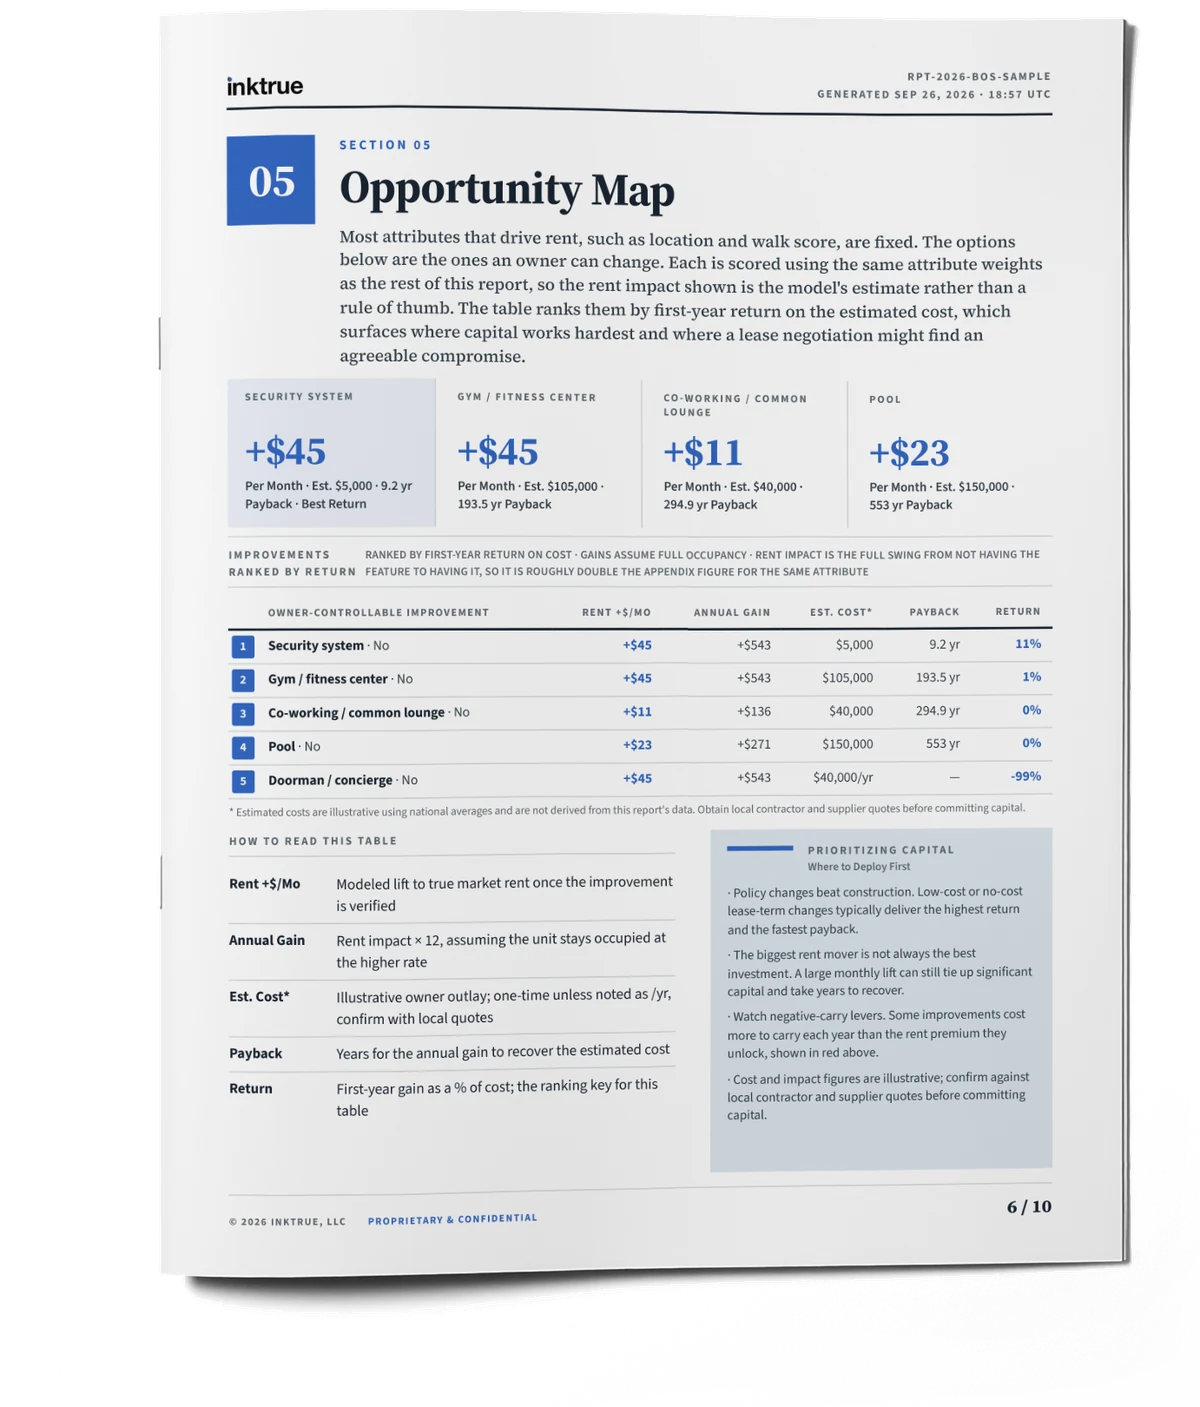
Opportunity Map
Not every gap between asking and true market rent has to be closed by lowering the price. Our analysis ranks the estimated value of upgrades and policy changes, like allowing pets or offering the unit furnished, by how much rent they'd justify against what they cost to implement. It gives an owner a data-backed alternative to a straight rent cut, and gives a tenant visibility into which amenities are actually driving the price up or what upgrades they could ask for to justify an above market rent.
Page 7 of 10 · Section 06
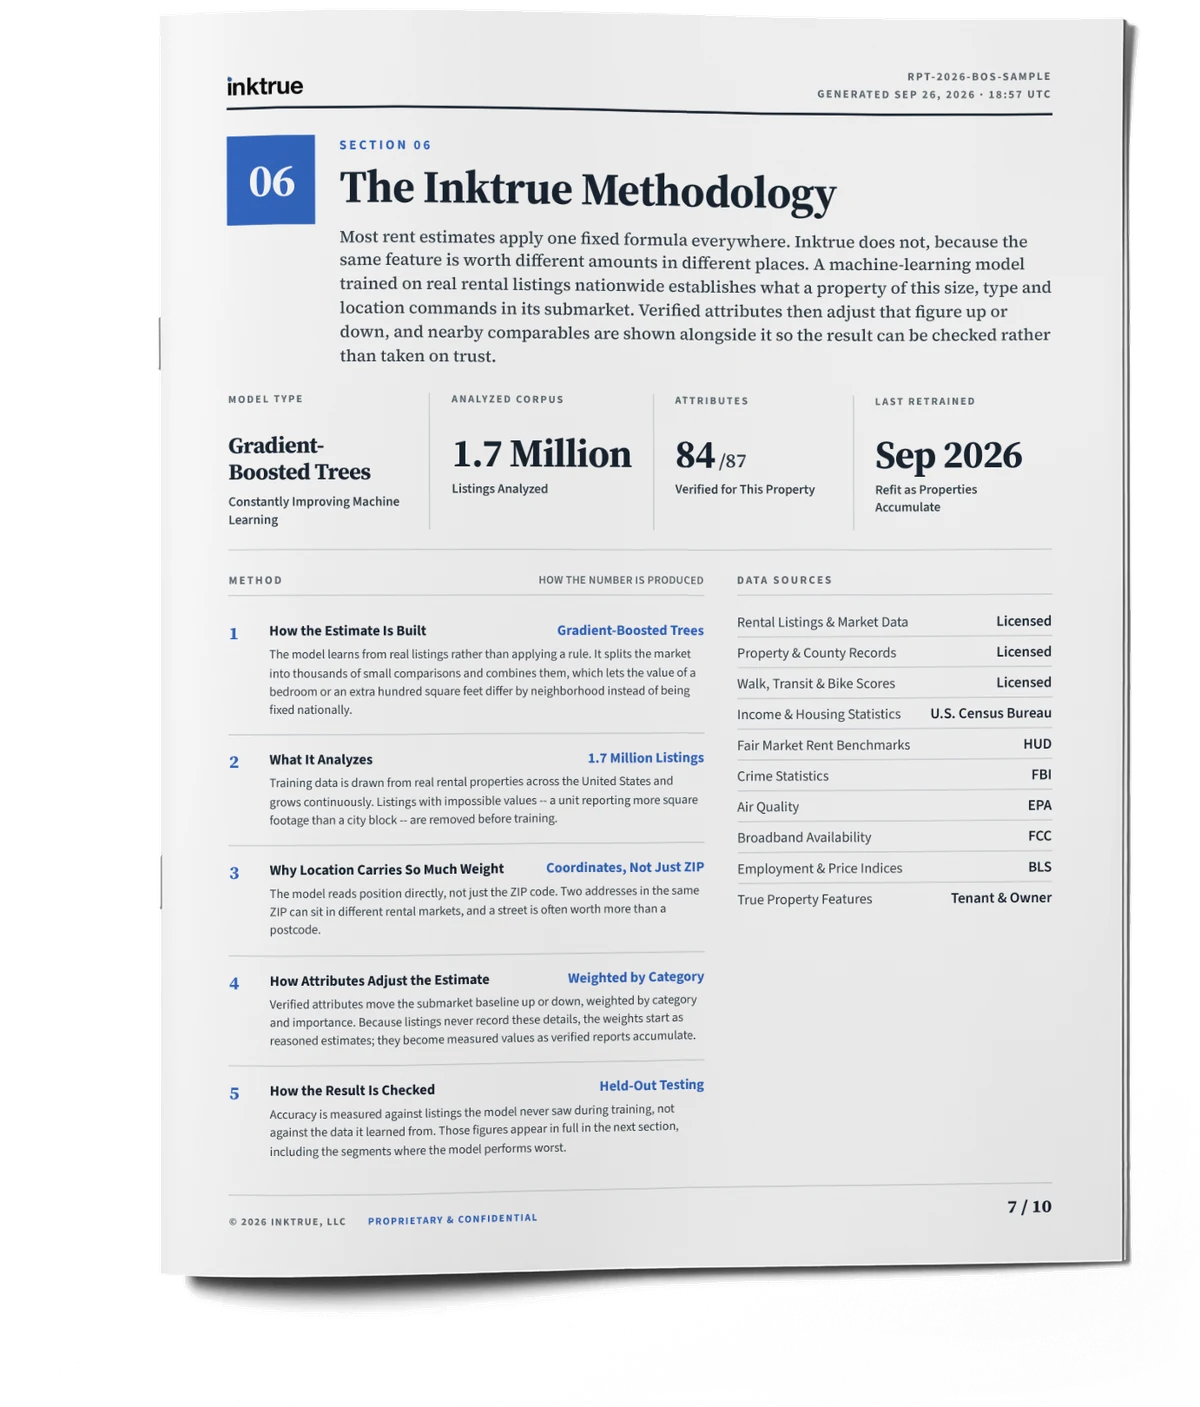
The Inktrue Methodology
The full method behind the Inktrue estimate: how our machine learning model was trained, the unique data sources we feed it, and how a property's individual attributes are converted into dollar adjustments against its submarket baseline. Most rent estimates keep their methodology hidden. We publish it, which is what lets either party, or a third party like an agent, broker, or attorney, check the math instead of just taking the number on blind faith.
Page 8 of 10 · Section 07
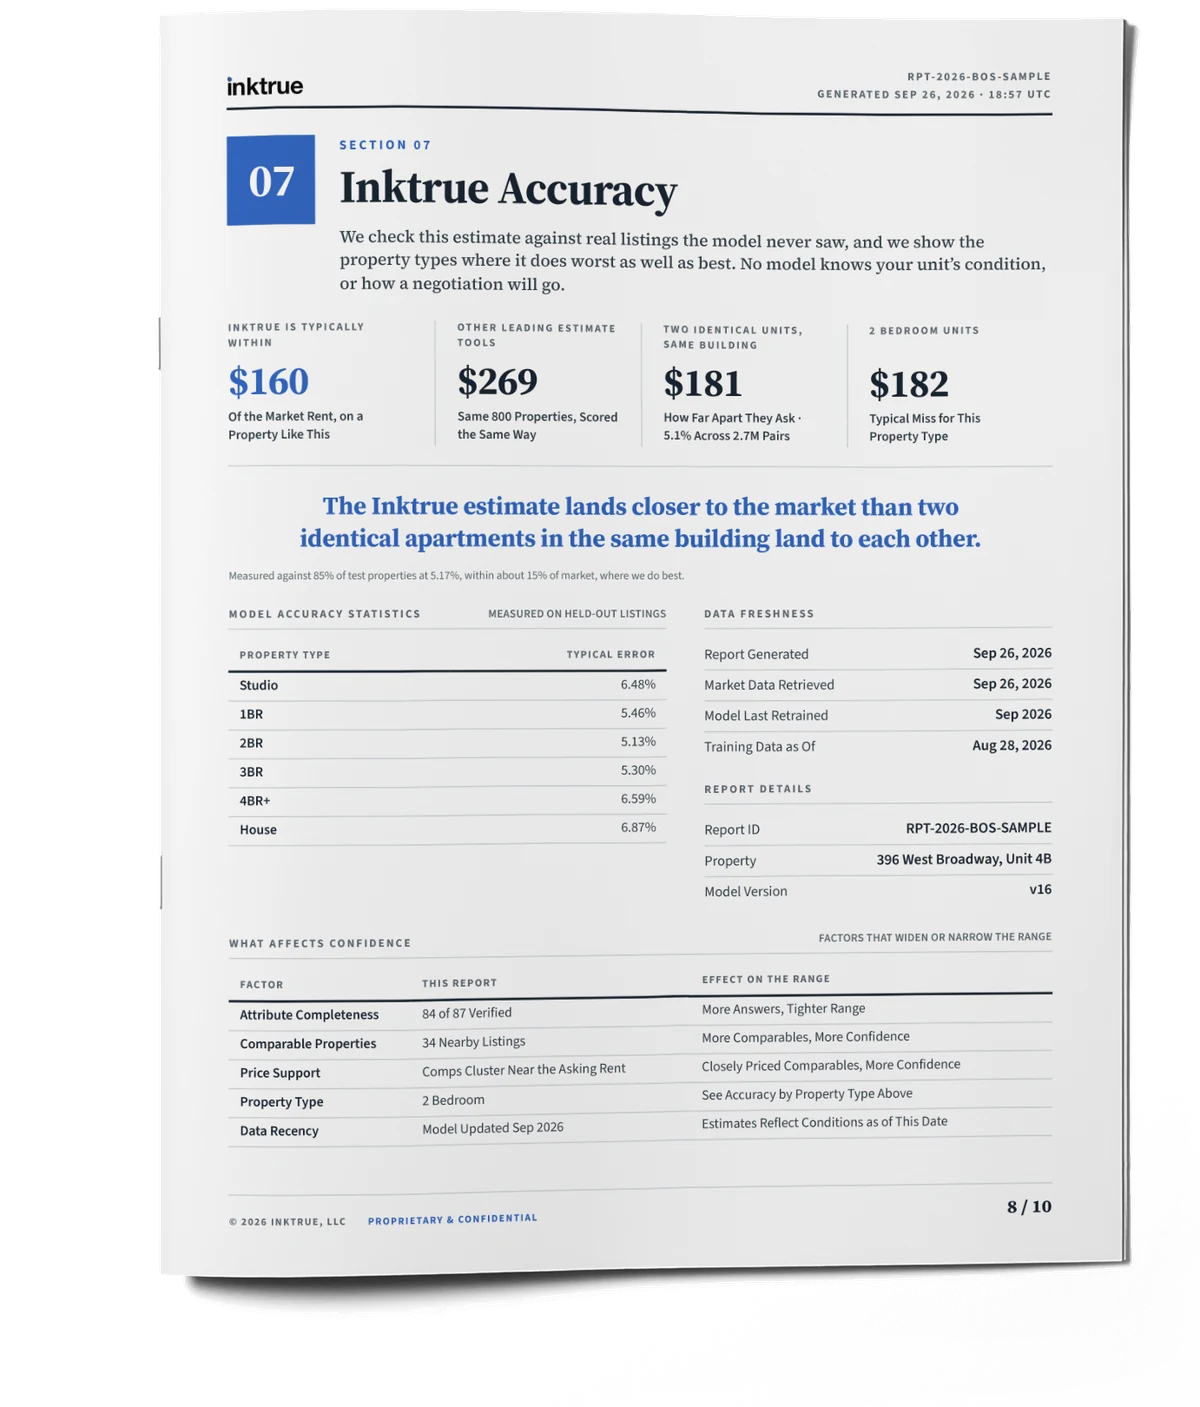
Report Accuracy
A number is only as trustworthy as its track record. This page reports the model's measured error rate in the real world, broken out by property type, so the accuracy shown is the accuracy for a unit like this one rather than a flattering headline average. It also records when the model was last retrained and how current the market data is, alongside the full legal disclaimer. Publishing the error rate, not just the estimate, is what separates an accountable data analysis team from a black box.
Page 9 of 10 · Appendix
Property Data Appendix (Part 1)
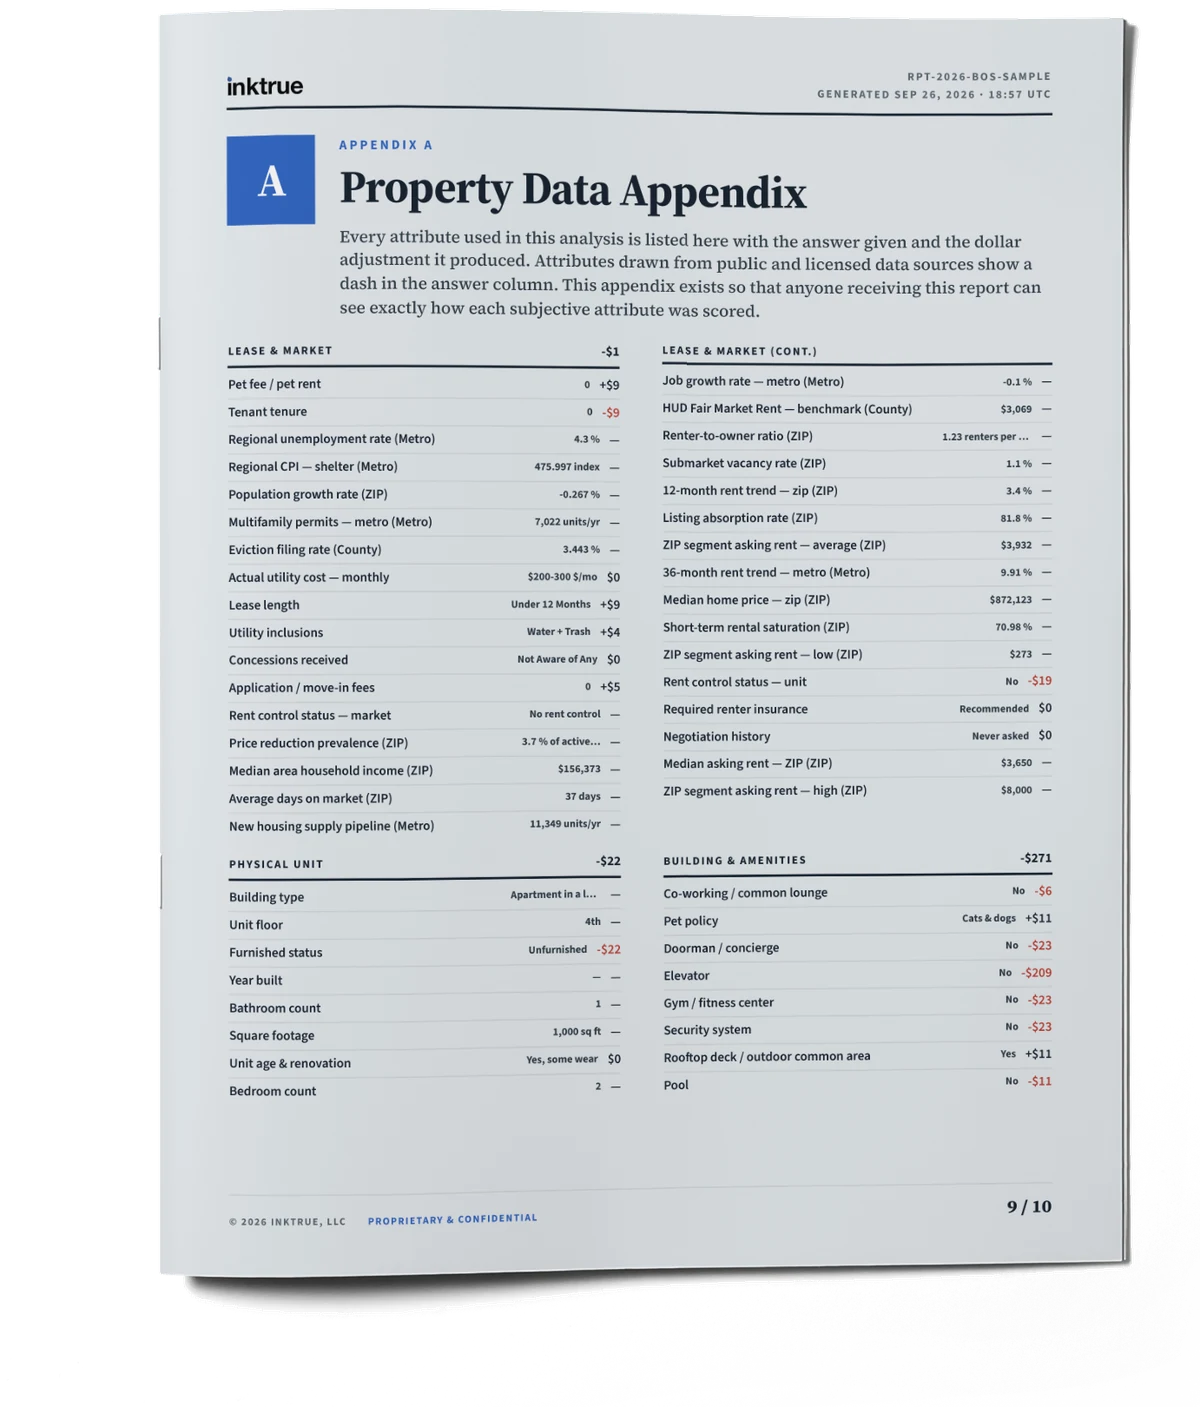
The data appendix lists every attribute score or input and the dollar adjustment it produced. This appendix exists so anyone receiving the report can see exactly how each subjective attribute was scored, which is what lets a tenant or owner audit the analysis line by line instead of trusting the total. If the report is missing data, or has incorrect information, we encourage you to run a new report. The more accurate the data, the more precise the results will be.
Page 10 of 10 · Appendix
Property Data Appendix (Part 2)
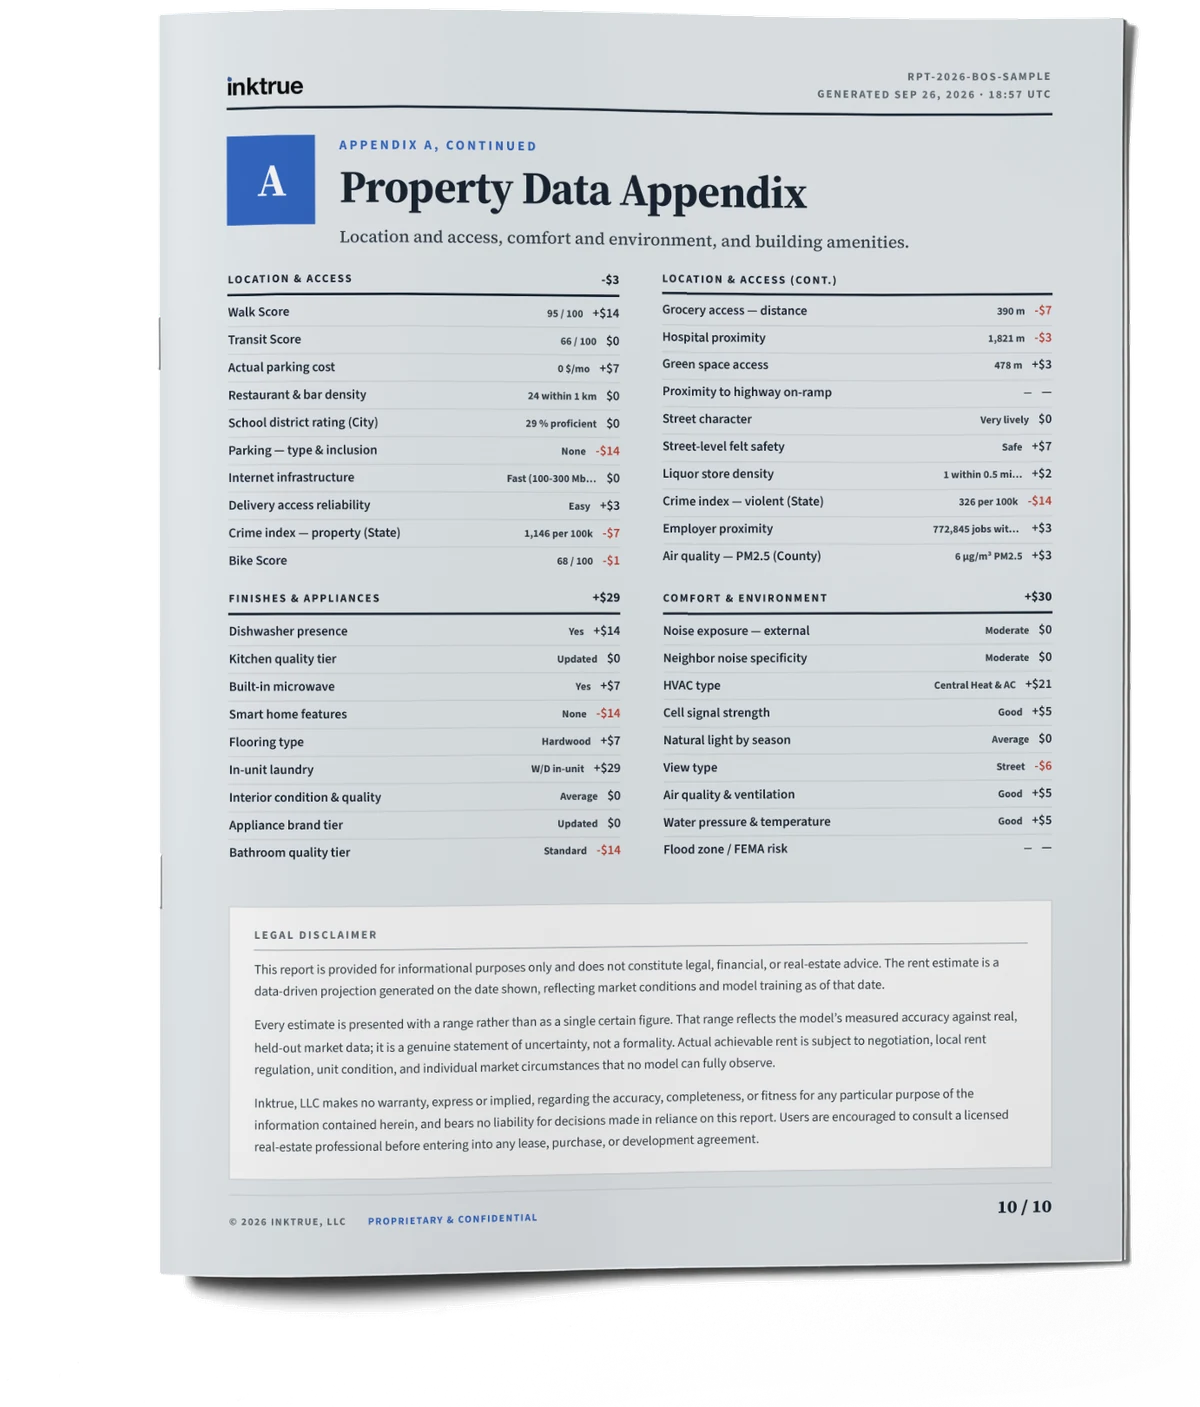
The second page continues through more report data and the appendix is itemized the same way as the first. We also include a legal disclaimer. While we take great pride in trying to be as accurate as possible, we are not giving financial advice, nor are we a substitute for your own rigorous due diligence. Bottom line, we're trying to help reduce friction in the rental market by using data analysis that benefits both tenants and landlords.
Get this same report for your address.
Free, independent, and ready in about ten minutes.
Get My Free Report